
Neptune Systems AquaController Pro
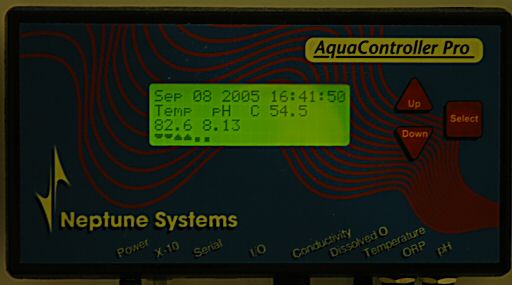
The cryptic icons on the bottom line show state or status of Timers such as the lights. The first icon shows actinics OFF, the second shows halides OFF. Little rays come out of the icons when they are turned ON. The next two icons are fans with the first being a sump fan OFF and the second being a room ventilation fan OFF. The icons point downwards when they are ON.
This Neptune Controller is a key part of the aquarium operation. In past setups I’ve had constant issues with heat and tank overheating, malfunctioning CO2 regulators, etc. The AquaController Pro can monitor parameters for each probe attached and perform actions using a built in scripting language. It can also act as a standard light timer. The AquaController Pro can interface directly to X10 devices or special Neptune Direct Connect switch boxes.
For example, it can turn actinics on at 10am and halides on at 11am while monitoring temperature. It can turn on a chiller, sump fan, room ventilation system or even turn off the halides or any combination or all of them. Whatever you script it to do. The controller can monitor pH and turn off a calcium reactor if it gets to low. You can set alarms for set events such as high temperature, low pH, low conductivity (salinity). An audible alarm module can be turned on, a pager can be notified, newer models can send an e-mail. You can set the rate data is sampled, store it on internal memory for later downloading to a computer.
Information displayed:
- Date: September 8, 2005
- Time: 16:41:50 (4:41 PM)
- Temp: 82.6°F
- pH: 8.13
Below is an example of one of the earlier scripts I wrote for the AquaController Pro controller. It uses a BASIC like programming language that is entered from the front panel using the 3 buttons present. It’s surprisingly easy and quick to enter and edit a program script.
| Code | Description | Comment |
|---|---|---|
ACT-A01 | Actincs use device port A01 | The first block of code defines names to devices and maps the X10 port number to the device name. |
HQI-B01 | Halides use device port B01 | |
VFA-A02 | Ventilation Fan (Room) uses A02 | |
CFA-A03 | Cooling Fan (Sump) uses A03 | |
ALM-C01 | Alarm module uses C01 (future use) | |
CO2-A04 | CO2 regulator use A04 (future use) | |
If Time > 00:00 Then ALM OFF | set alarm off. | If Time statements allow the Controller to act as a standard timer to turn devices such as light fixtures on and off based on time of day. |
If Time > 07:59 Then ACT OFF | turn off actinics. | |
If Time > 22:00 Then ACT ON | turn on actinics. | |
If Time > 07:00 Then HQI OFF | turn off halides. | |
If Time > 23:00 Then HQI ON | turn on halides | |
If Time > 08:00 Then VFA OFF | turn off room vent. | |
If Time > 22:00 Then VFA ON | turn on room vent. | |
If Temp < 77.0 Then ALM ON | set low temp alarm. | If Temp allows the controller to react to temperature changes in the aquarium thanks to its temperature probe. |
If Temp < 81.0 Then CFA OFF | turn off sump fan | |
Max Change 005 M Then CFA OFF | for at least 5 minutes. | |
If Temp > 83.0 Then CFA ON | turn on sump fan | |
Max Change 005 M Then CFA ON | for at least 5 minutes. | |
If Temp > 85.0 Then HQI OFF | turn off halides | |
Max Change 010 M Then HQI OFF | for at least 10 minutes. | |
If Temp > 85.0 Then ALM ON | set high temp alarm. | |
If pH < 07.90 Then ALM ON | set low pH alarm. | If pH allows the controller to react to pH changes in the aquarium thanks to its pH probe. |
If pH < 08.00 Then CO2 OFF | turn off regulator. | |
If pH > 08.50 Then ALM ON | set high pH alarm. | |
If Cond < 50.0 Then ALM ON | set low salinity alarm. | If Cond allows the controller to react to conductivity changes in the property of the tank water. In this case salinity is changing the conductivity of water. |
If Cond > 57.0 Then ALM ON | set high salinity alarm. | |
If Power Fail Then ALM ON | set power outage alarm. | If Power Fail allows the controller to send alerts when a power failure is detected on the AC adapter used by the controller. |
If Battery Low Then ALM ON | set low internal battery alarm. | If Battery Low allows the controller to send an alert if its internal battery needs to be replaced. It is used in events such as power outages to preserve programs and data logged. |
If Feed cycle Then VFA ON | use feed button to turn on room vent. | If Feed Cycle performs a set action when the feed button is pressed. In this case instead of turning off water pumps to feed, I use the button as an override to turn on the room ventilation fan if I feel the room is too humid. |
If Temp > 82.3 Then VFA ON | turn on room vent. | |
Max Change 060 M Then VFA OFF | for at least 60 minutes. | |
Max Change | Max Change is a modifier. It modifies the command in front of it and sets a duration for a condition. If the temperature fluctuates between 84.9 and 85.1 you do not want your lights turning on and off rapidly. This command can set a state and force that state to be kept for a set time such as 5, 10 or 60 minutes before testing the parameter again. | |
Below is an example of a portion of a data dump from the AquaController to my computer via a serial cable. I have the AquaController Pro set to take and store a measurement every 15 minutes.
| Date/Time | Temp | pH | Cond |
|---|---|---|---|
| 18:00 06/16/2005 | 81.3 | 8.26 | 55800 |
| 18:15 06/16/2005 | 81.3 | 8.26 | 55800 |
| 18:30 06/16/2005 | 81.3 | 8.26 | 55800 |
| 18:45 06/16/2005 | 81.3 | 8.26 | 55800 |
| 19:00 06/16/2005 | 81.3 | 8.27 | 55800 |
| 19:15 06/16/2005 | 81.3 | 8.27 | 55900 |
| 19:30 06/16/2005 | 81.3 | 8.27 | 55900 |
| 19:45 06/16/2005 | 81.2 | 8.27 | 55900 |
| 20:00 06/16/2005 | 81.2 | 8.27 | 55700 |
| 20:15 06/16/2005 | 81.2 | 8.27 | 55700 |
| 20:30 06/16/2005 | 81.1 | 8.26 | 55800 |
| 20:45 06/16/2005 | 81.1 | 8.26 | 55800 |
| 21:00 06/16/2005 | 81.1 | 8.26 | 55800 |
| 21:15 06/16/2005 | 81.0 | 8.26 | 56000 |
| 21:30 06/16/2005 | 81.0 | 8.25 | 55900 |
| 21:45 06/16/2005 | 81.0 | 8.25 | 55900 |
| 22:00 06/16/2005 | 81.0 | 8.24 | 55700 |
| 22:15 06/16/2005 | 80.9 | 8.24 | 55900 |
| 22:30 06/16/2005 | 80.9 | 8.23 | 55700 |
| 22:45 06/16/2005 | 80.9 | 8.23 | 55900 |
| 23:00 06/16/2005 | 80.9 | 8.23 | 55700 |
| 23:15 06/16/2005 | 81.0 | 8.22 | 55900 |
| 23:30 06/16/2005 | 81.1 | 8.23 | 55900 |
Most of the columns are easy to figure out. The “Cond” column is the conductivity. The decimal point is not displayed. The actual value looks like “55.8” which is slightly high. 53 is the equivalent of 35 PPT or 1.026.
The data dump from the AquaController can be Cut & Pasted into Microsoft Excel and graphed to show trends in the aquarium parameters.
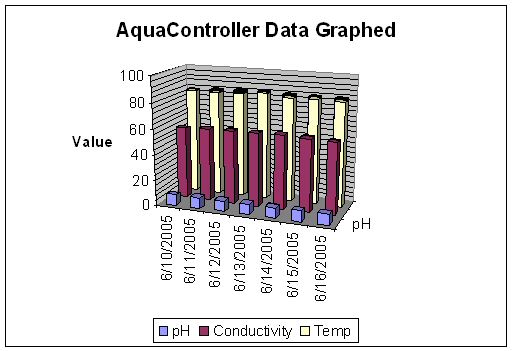
The sample graph to the left shows fairly stable data points.
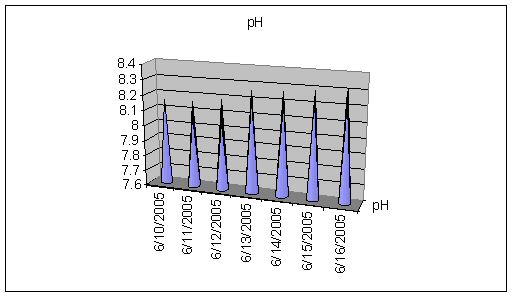
pH data from the AquaController graphed in Microsoft Excel showing on average an upward trend for the week.
